 Games
Games Tools
Tools Exams
Exams Grade 10
 Grade 11
 Grade 12
 Resources
 Free Stuff
 Misc
Misc


Stop Teaching the Textbook. Start Teaching Through the PAT.
Every year, the CAT PAT is treated like that dramatic plot twist nobody prepared for
We calmly “cover” theory from the textbook…
We teach formulas.
We do isolated database exercises.
We tick syllabus boxes.
And then suddenly — boom.
“Okay class, now independently complete a complex, integrated, multi-phase practical project that requires critical thinking, research, referencing, integration and professional reporting. Good luck!”
Cue mild panic. From learners. And teachers.
But what if we flipped the script?
What if the PAT wasn’t something we survive at the end of the year — but something we teach through from the beginning?
The CAT PAT is not extra work.
It is literally the most authentic teaching opportunity in the entire Grade 12 syllabus.
The PAT Is Already a Complete Teaching Framework (It’s Basically a Free Curriculum Gift)
If you actually unpack the PAT requirements, something slightly mind-blowing happens.
It already includes:
– Research skills
– Critical thinking
– Data handling
– Spreadsheet processing
– Database design
– Application integration
– Formal report writing
– Referencing
– Evaluation and reflection
In other words… everything we try to teach separately.
Instead of:
– “Today we’re doing VLOOKUP from page 143.”
– “Today we’re learning about queries. Don’t ask why.”
– “Today we’re inserting a table of contents for absolutely no real reason.”
We could be saying:
– “Today we’re using VLOOKUP to solve a real problem in your PAT.”
– “Today we’re building a query that answers one of your research questions.”
– “Today we’re setting up your final report properly so you don’t cry in September.”
That tiny shift changes everything.
Phase 1: Teach Research Properly (Not Just Advanced Copy-Paste)
Let’s be honest.
Phase 1 often becomes:
– Vague task definition ✔
– 15 questions that all start with “What is…” ✔
– Three websites copied with enthusiasm ✔
But Phase 1 is actually gold.
Learners must:
– Define the task in their own words
– Create a clear key question
– Generate 15 varied questions
– Use at least three different sources
– Validate information
– Reference correctly
This is where real teaching happens.
You can:
– Teach the difference between weak and strong questions
– Show how to spot a dodgy website in 30 seconds
– Model proper Harvard referencing (without everyone guessing the punctuation)
– Workshop task definitions before they’re marked
Instead of marking 30 weak Phase 1 submissions and sighing heavily…
You refine them in class.
Marks improve. Quality improves. Blood pressure improves.
Phase 2: Teach Practical Skills in Context (a.k.a. “Why Are We Even Doing This?” Solved)
Phase 2 Task 1 is not about “doing Excel.”
It’s about solving a data problem.
When learners understand:
– Why they are building a Pivot Table
– Why they are cleaning data
– Why a formula matters
— engagement changes instantly.
When Access tables reflect their own research data, database design stops feeling like a punishment exercise and starts making sense.
The PAT allows you to:
– Demonstrate a feature
– Let learners apply it immediately
– Walk around and fix mistakes in real time
– Stop errors before they multiply like Excel circular references
That is far more powerful than textbook drills.
The Final Report: Where Word Either Shines or Breaks Spirits
The Final Report requires:
– Structured headings
– Automatic table of contents
– Integration explanation
– Data analysis
– Reflection
– Bibliography
Instead of teaching Word features randomly in March because “it’s on the syllabus,” you can teach them exactly when learners need them.
– Section breaks while setting up the report
– Styles while building the TOC
– Captions while inserting graphs
– Referencing tools in a real research context
Suddenly Word isn’t just “formatting stuff.”
It’s professional communication.
And learners can actually see why it matters.
Real-Time Feedback = Fewer September Meltdowns
When the PAT becomes your live teaching framework:
– Weak task definitions are fixed early
– Poor questions improve before research starts
– Incorrect formulas don’t get repeated 47 times
– Database relationships are corrected before submission
– Referencing errors don’t snowball
The result?
– Better quality work
– Higher independence
– Stronger final marks
– Much less last-minute chaos
And fewer “Ma’am, my file is corrupt” conversations.
A Structured Tool to Support Teachers (Because We Also Need Backup)
To support this approach, I created a PAT Support App designed to:
– Clearly explain all PAT phases and tasks
– Provide guidance without encouraging copying
– Focus learners on structure and assessment criteria
– Encourage independent, logical progress
– Align with what is actually assessed
It doesn’t replace teaching.
It supports it.
Teachers can:
– Project sections during lessons
– Use it while explaining tasks
– Encourage independent use
– Share it for structured guidance
You’re welcome to use or share it:
Click here to access it.
Feedback from teachers is very welcome (especially the “why didn’t we think of this earlier?” kind).
My Final Thought for CAT Teachers
The PAT is not an administrative headache.
It is the most real-world, skills-based part of the CAT curriculum.
If we shift from:
“Let’s finish the textbook before the PAT.”
to:
“Let’s teach through the PAT.”
We turn a stressful end-of-year scramble into a guided, structured learning journey.
And honestly?
That’s what CAT was meant to be all along.

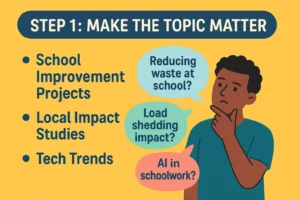 Pick a topic that means something to your learners. Instead of another dry survey on “transport methods” or “favourite foods,” challenge your learners to create a solution to a real-world problem.
 Data collection shouldn’t feel like a chore. Teach learners to create engaging surveys using Google Forms or Microsoft Forms, and show them how to use branching logic to make questions interactive.
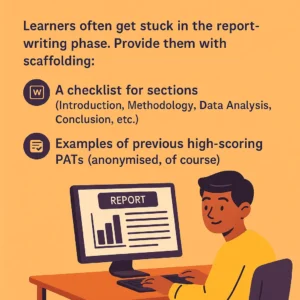 Learners often get stuck in the report-writing phase. Provide them with scaffolding:
 The PAT shouldn’t end as a static report on your desktop. Ask learners to present their findings—whether through a poster, a quick video summary, or a mock Shark Tank pitch where they “sell” their research.
 We’re not reinventing the wheel. The IEB PAT has clear outcomes: data collection, data analysis, Word processing, referencing, etc. All of that can still be done creatively. What changes is how we frame the task—and how much ownership we allow learners to take.